
Clinician Consulting Services

EEG/QEEG Analysis
High-Density qEEG
Dipole Localization
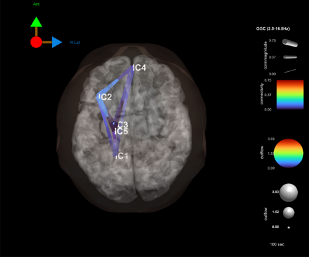
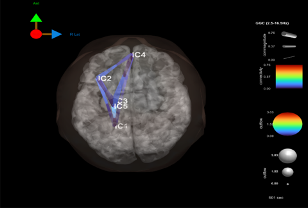
Effective Connectivity
What Brain Function Analysis Provides
A high‑resolution view of how neural networks activate, coordinate, and influence one another, allowing clinicians to identify the functional origins of cognitive, emotional, and behavioral symptoms.
Core Measures
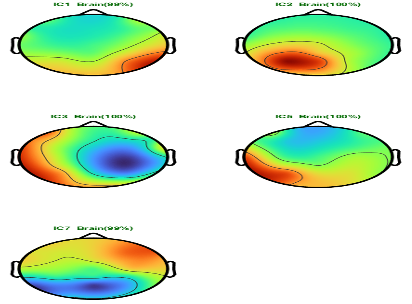
32‑Channel qEEG
Objective measurement of cortical electrical activity.
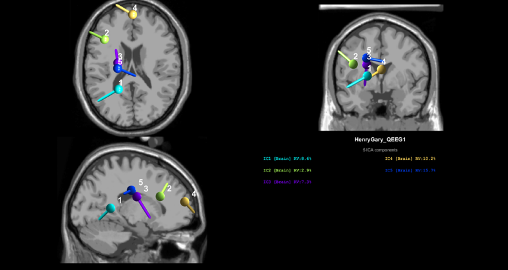
Dipole Localization
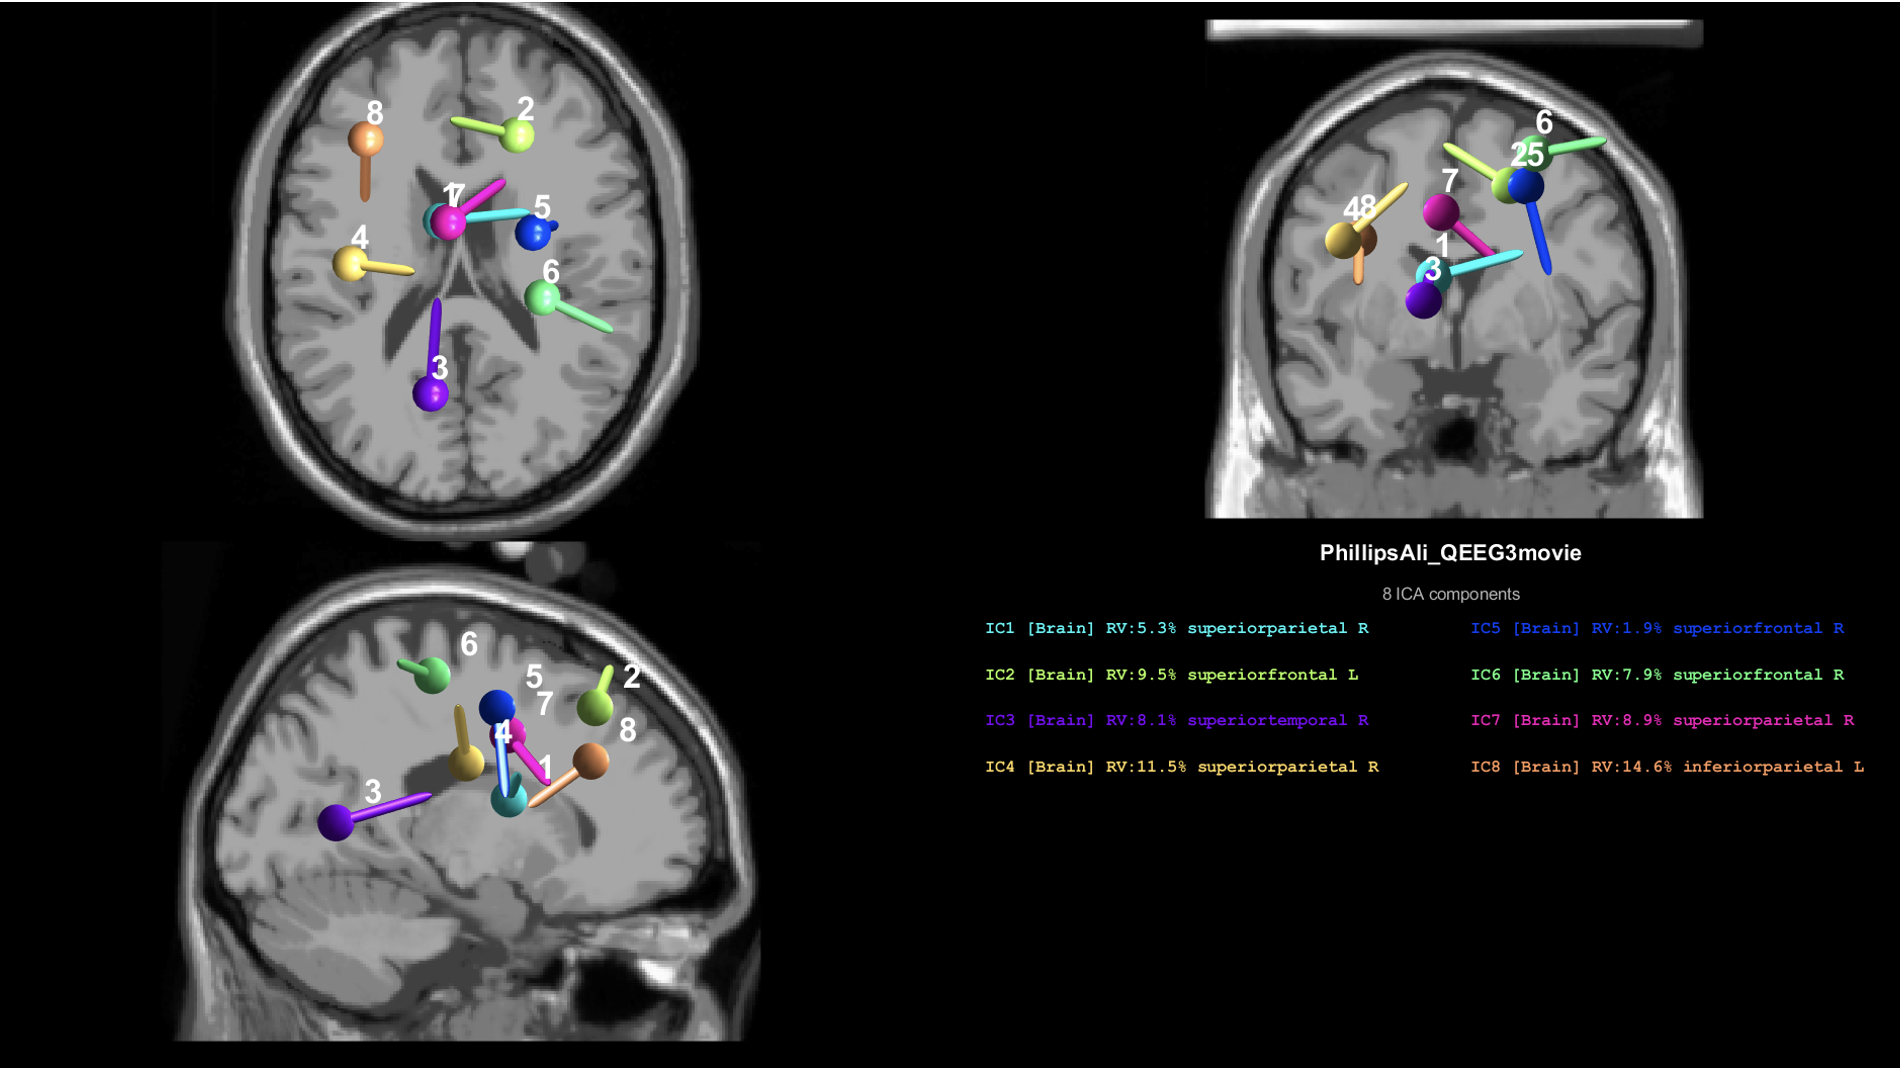
Mathematical modeling to identify where dysregulation originates.
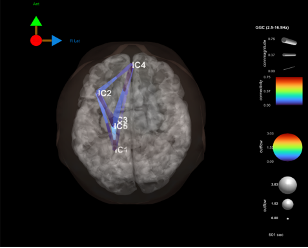
Effective Connectivity
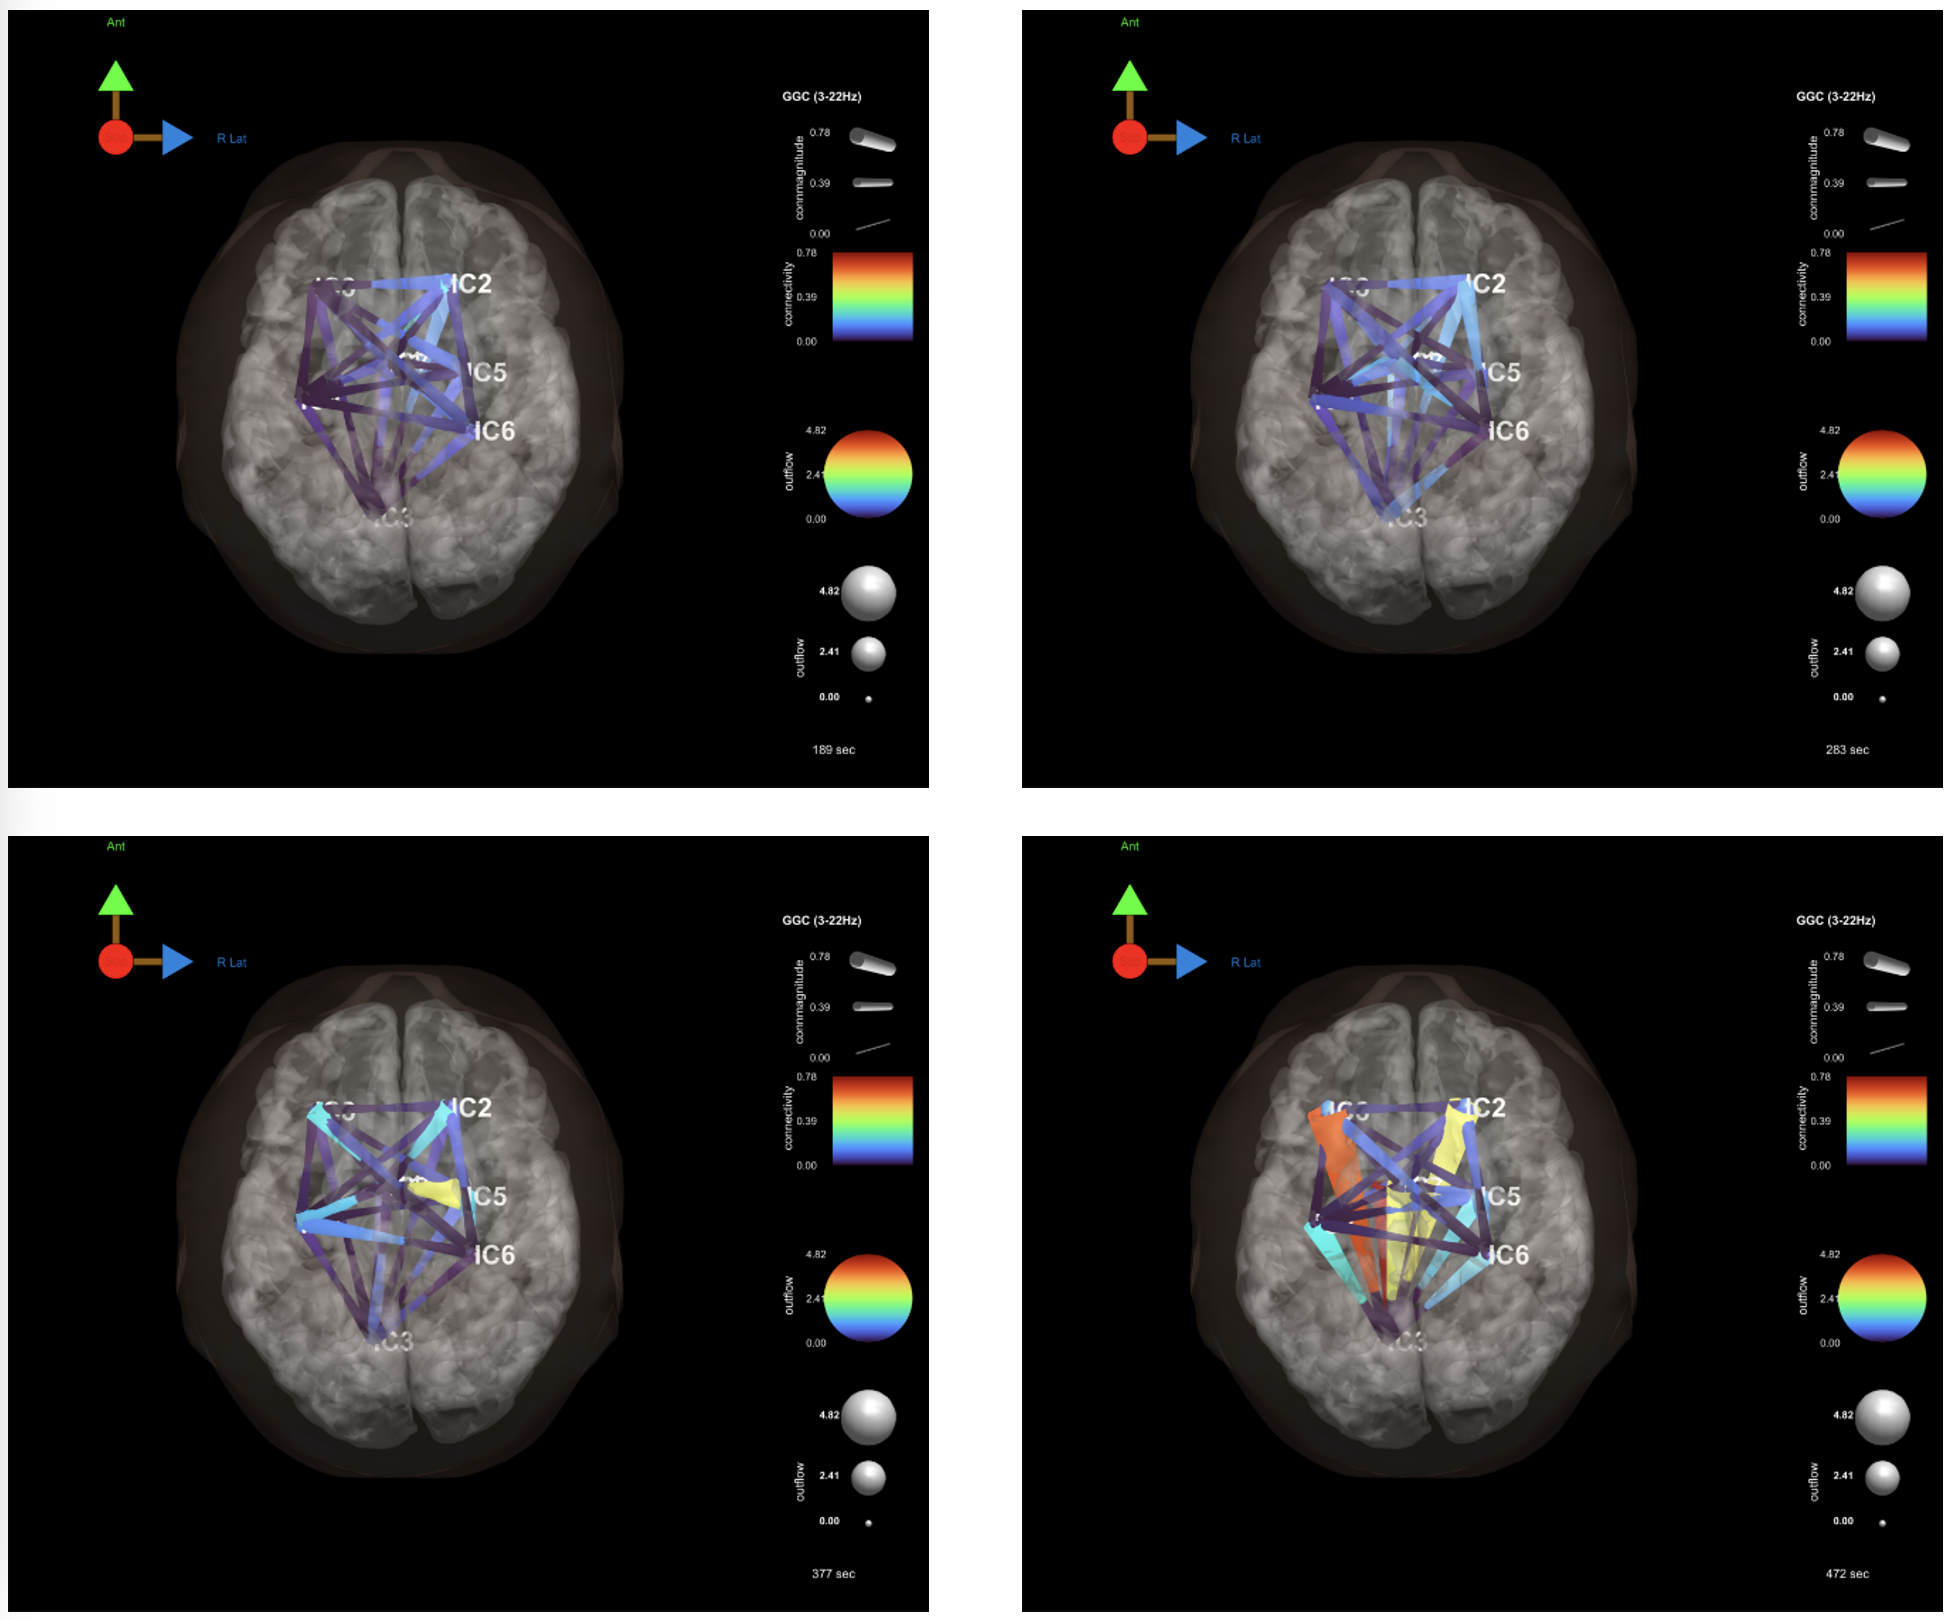
Shows how brain regions influence one another and how network communication patterns support or disrupt regulation.
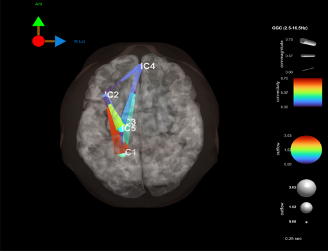
Effective Connectivity Over Time
Connectivity is dynamic. Tracking changes across the recording reveals how networks stabilize, fluctuate, or dysregulate during rest or task conditions.
Clinical Value
Identifies neural mechanisms underlying symptoms
Links qEEG to presenting symptoms and/or neuropsychological performance
Reveals network inefficiencies affecting regulation
Guides individualized, brain‑based treatment planning
EEG Processing Workflow
How Raw EEG Becomes Actionable Clinical Insight
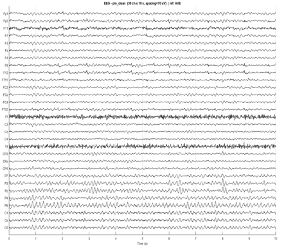
Step 1: EEG Cleaning
Removal of eye blinks, muscle activity, movement, and electrical noise.
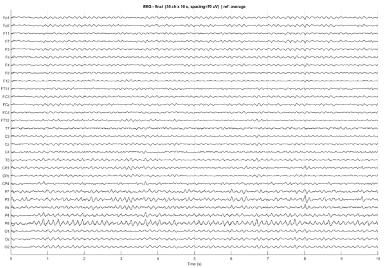
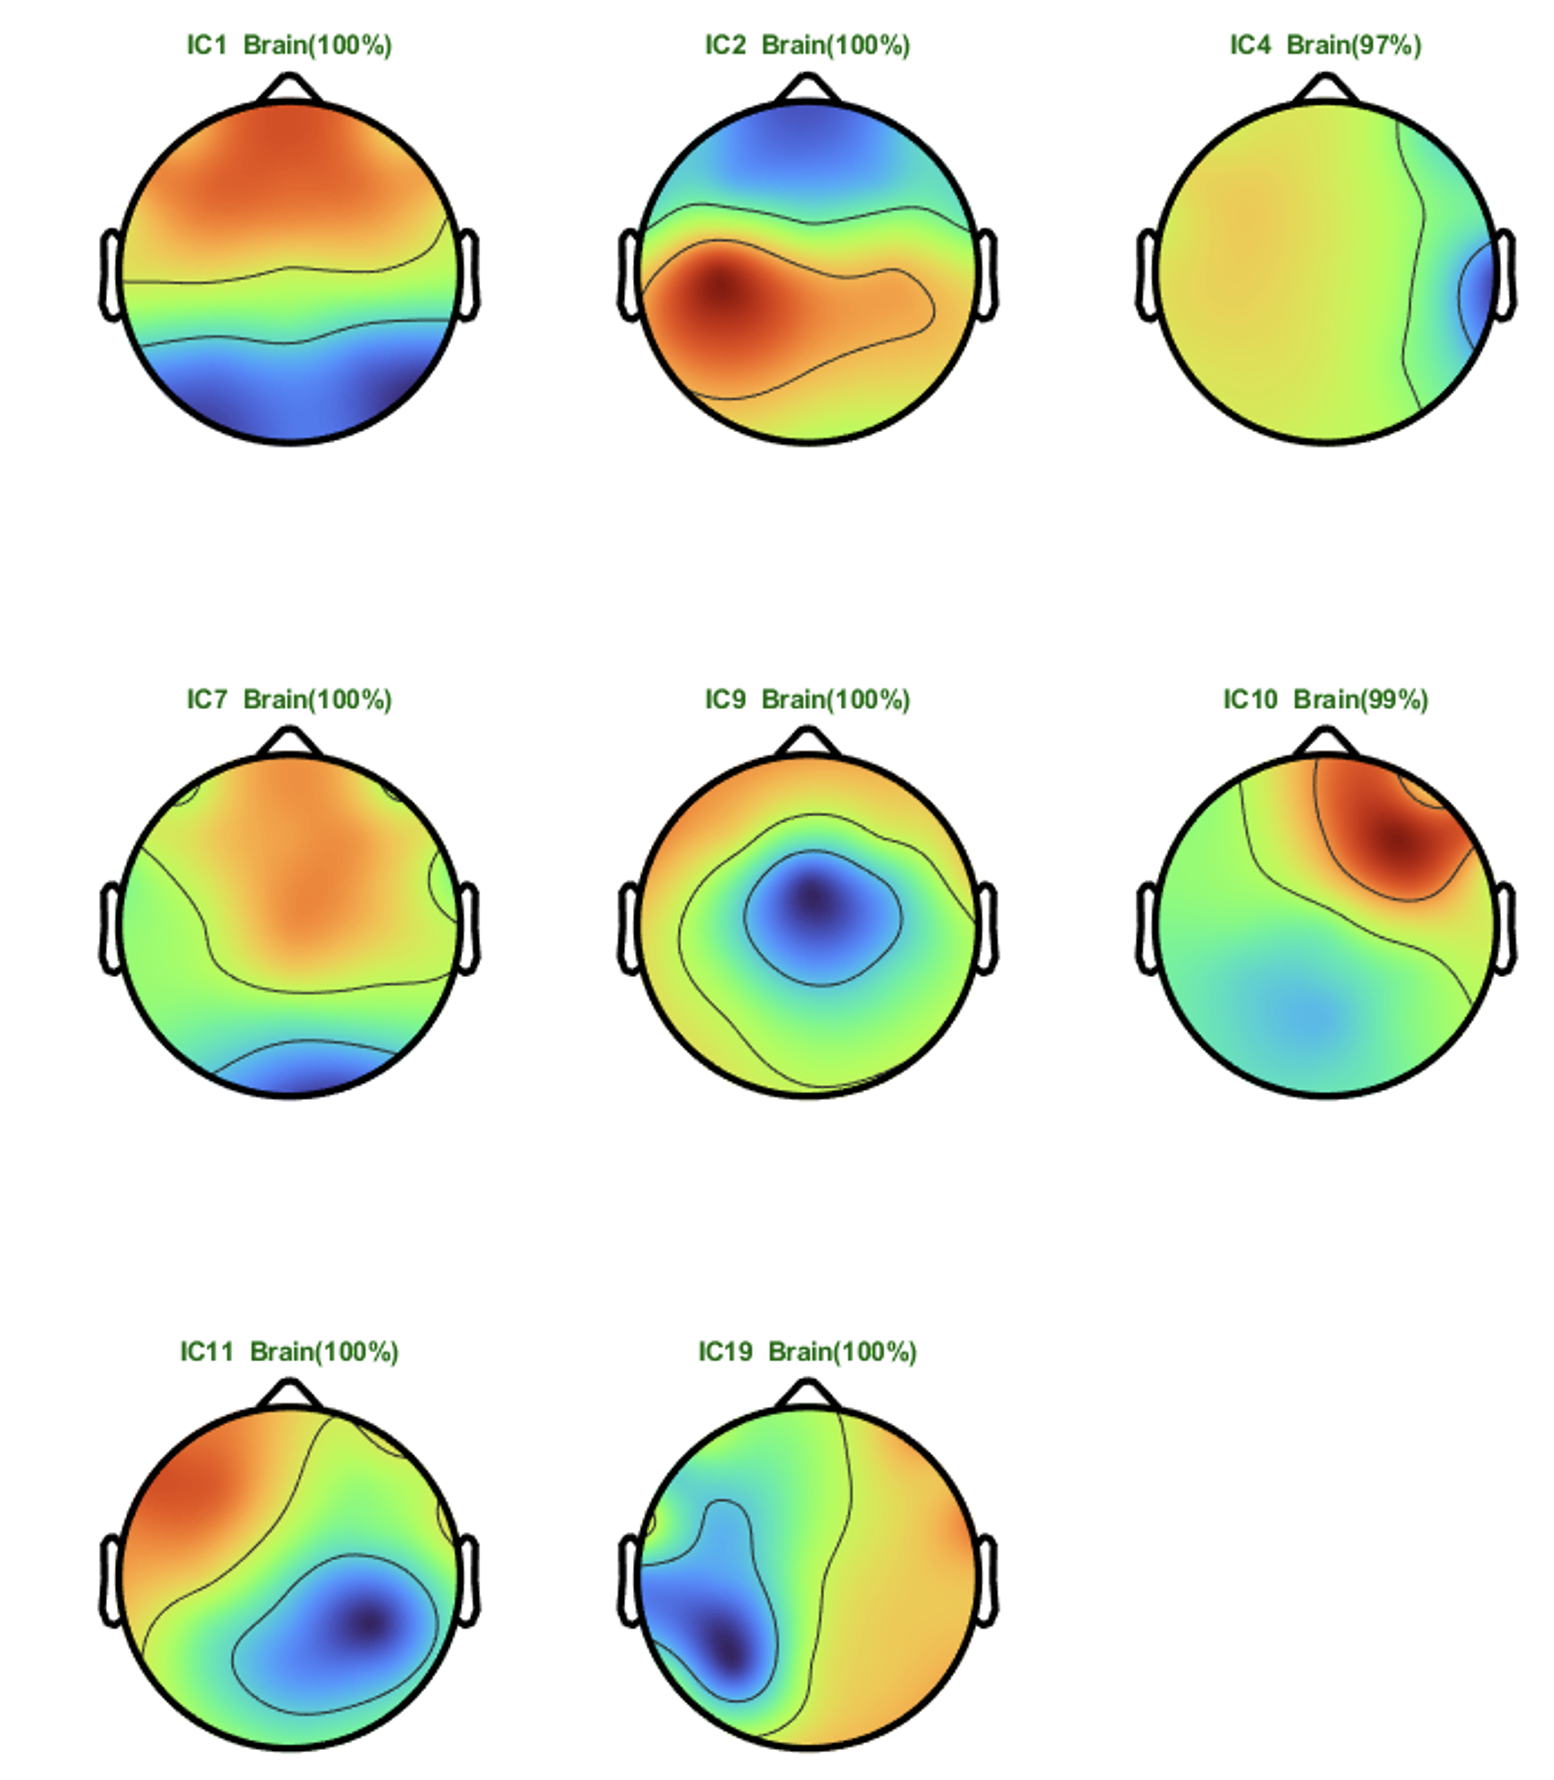
Step 2: Independent Component Analysis (ICA)
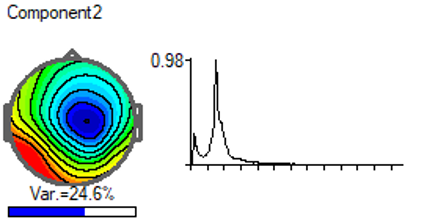
Separates mixed signals into independent neural and non‑neural components.
Step 3: Dipole Localization
Identifies the cortical origin of each ICA component.
Step 4: Multivariate Effective Connectivity Analysis
Quantifies communication between brain regions to reveal:
Over‑connectivity
Under‑connectivity
Network mis‑coordination
EEG/qEEG Analysis
Understanding how the brain functions requires more than observing symptoms or performance — it requires measuring how neural networks communicate, coordinate, and regulate activity. Our Brain Function Analysis uses high-density EEG and advanced computational tools to map these patterns with exceptional precision. Through this process, we examine the electrical activity of the brain, identify where dysregulation originates, and determine how different regions interact. This gives us a detailed, objective view of the neural architecture underlying cognitive, emotional, and behavioral functioning
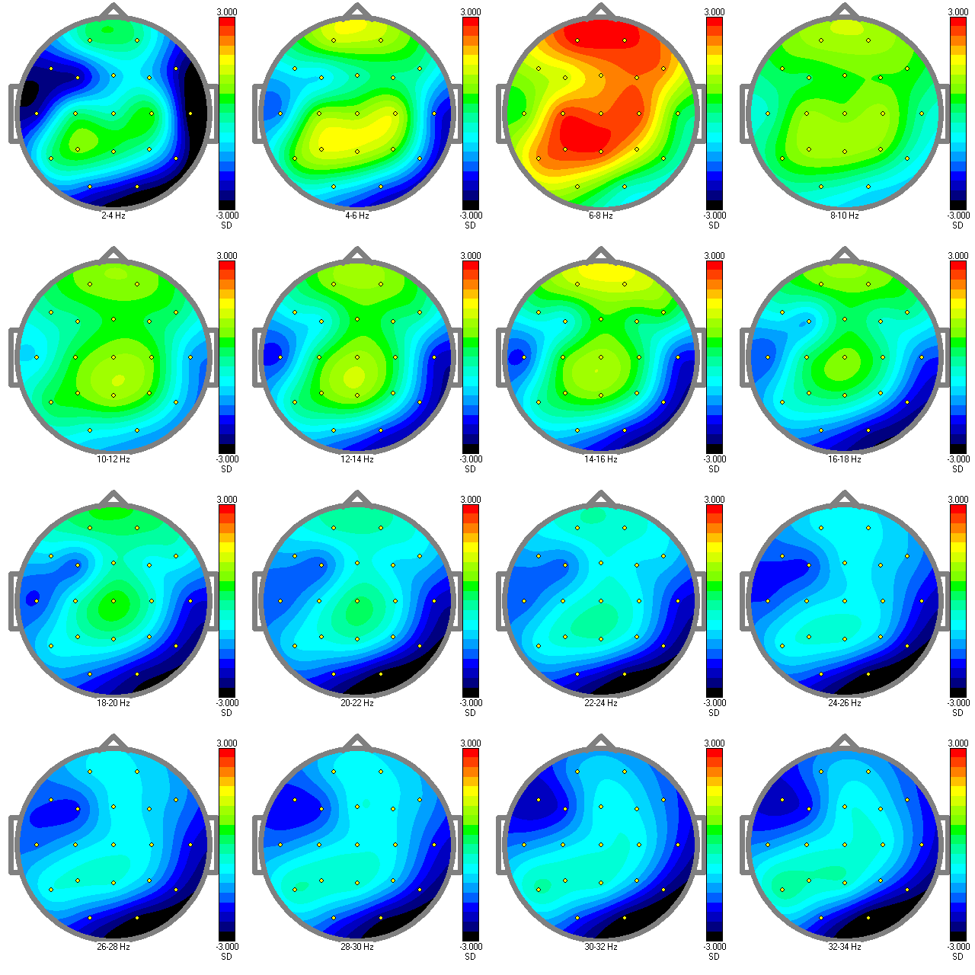
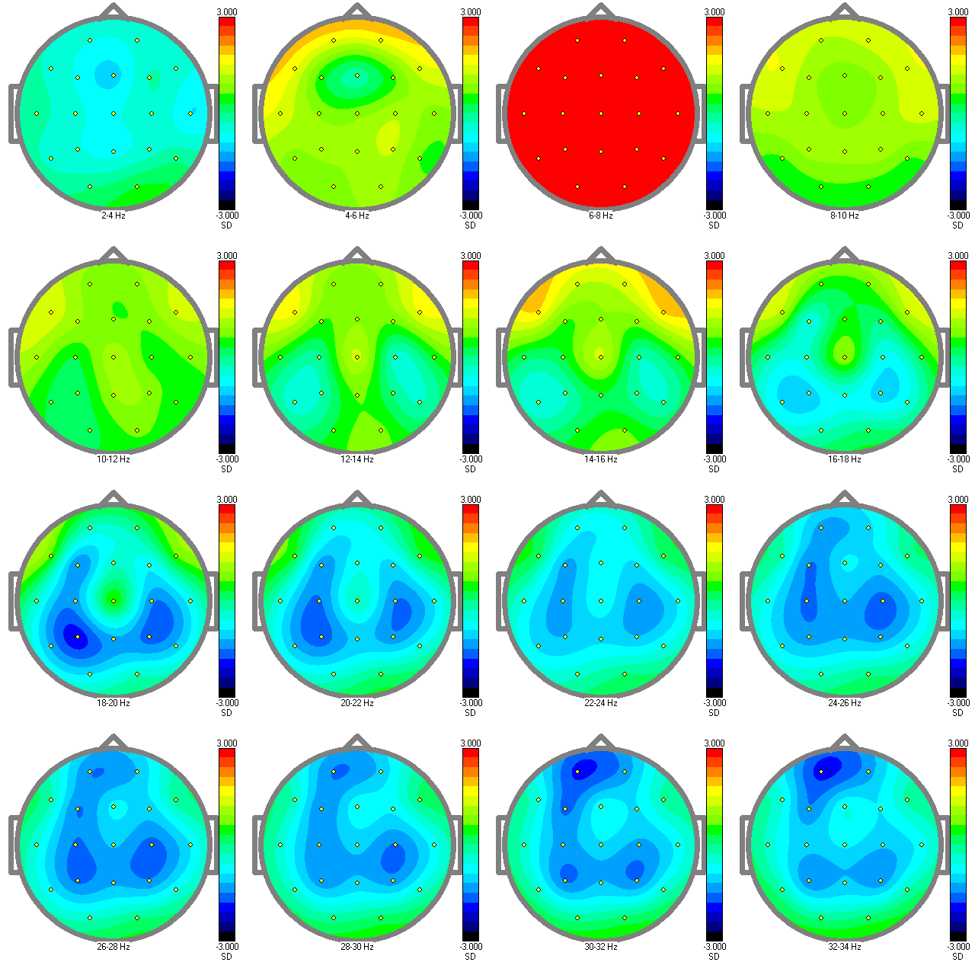
Absolute Power
Relative Power
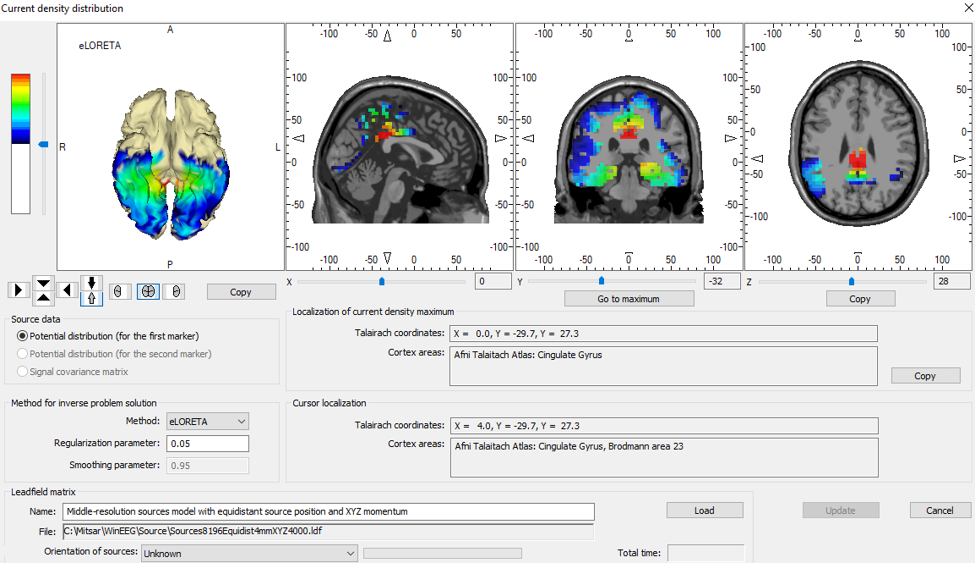
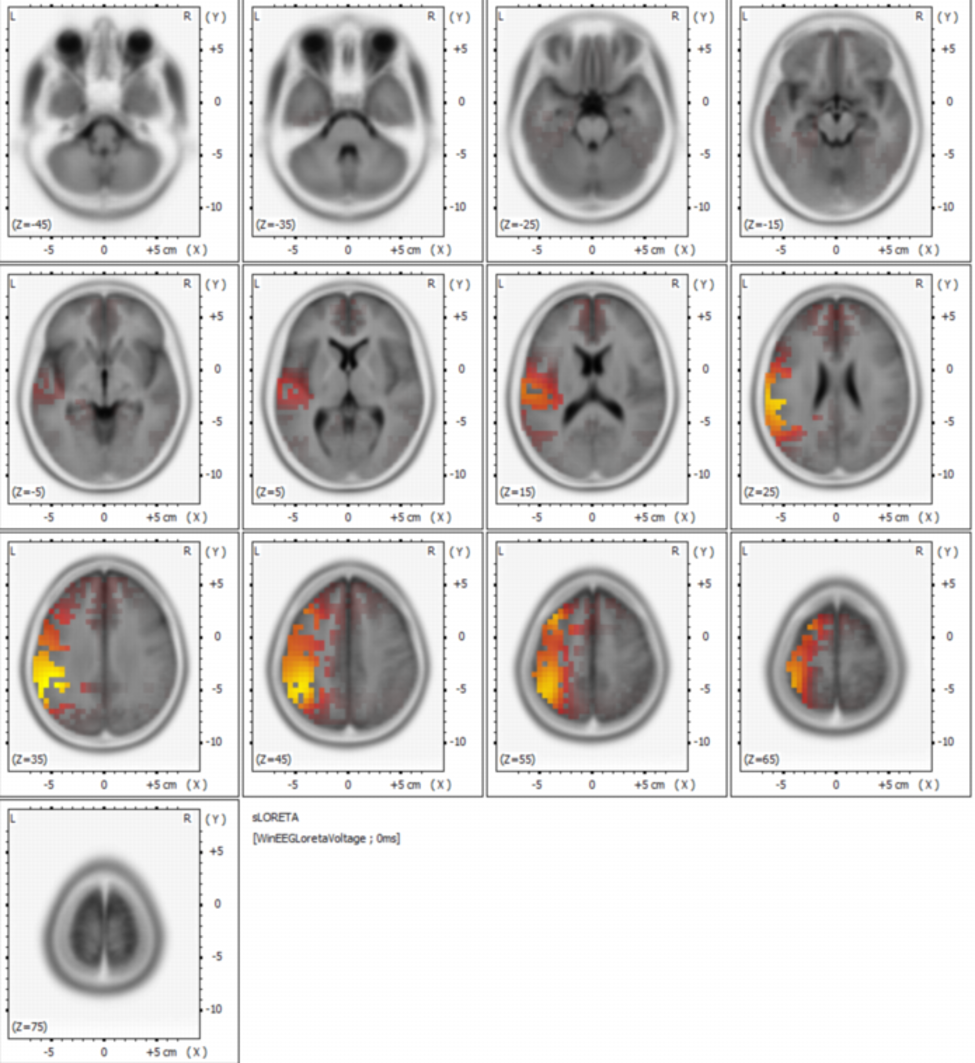
eLoreta
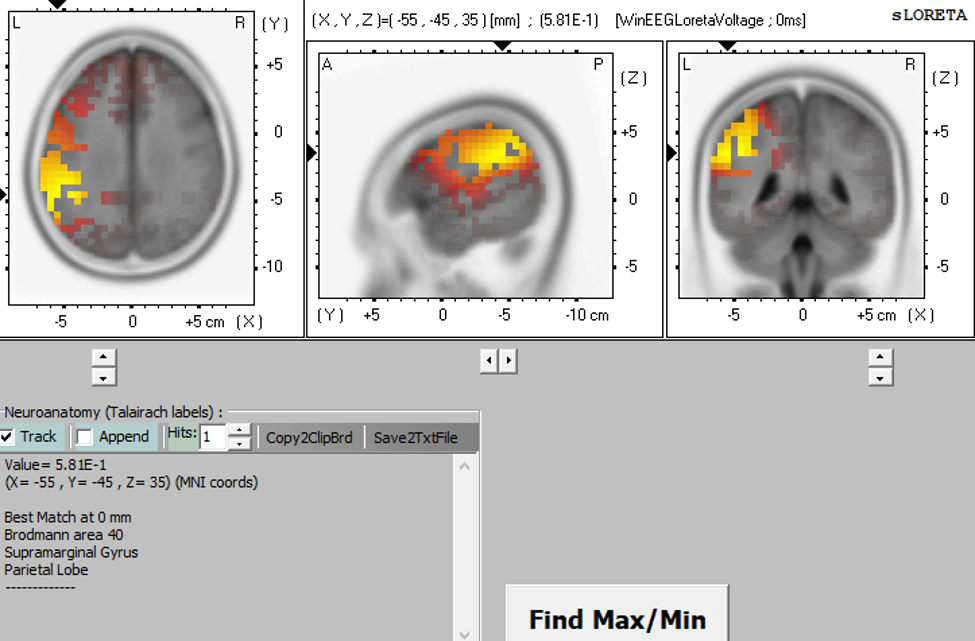
sLoreta
What We Measure
32-Channel QEEG
Captures real-time electrical activity across the cortex, revealing patterns of over-or-under-activation, network inefficiencies, and markers of dysregulation.
Source Localization
Uses mathematical modeling to identify where in the brain these patterns originate — pinpointing the specific regions and networks contributing to symptoms
Multivariate Coherence Analysis
Examines how brain regions communicate with one another. This analysis shows whether networks are overly connected, under-connected, or mis-coordinated, providing insight into functional integration and regulation.
Why This Matters
This level of precision allows us to:
Identify the neural mechanisms driving cognitive, emotional, and behavioral symptoms
Understand how networks coordinate — or fail to coordinate — during tasks and daily functioning
Connect QEEG findings directly to neuropsychological performance and clinical presentation
Design interventions that target the specific networks responsible for dysregulation
By integrating these advanced analyses, we move beyond surface-level symptoms to uncover the underlying neural pathways that shape functioning.
This forms the foundation for highly individualized, brain-informed treatment planning.
Professional Consultation & Supervision
Case‑based consultation for clinicians seeking deeper interpretation of qEEG findings, network dysregulation, and integration with neuropsychological or clinical presentations.
Areas of consultation include:
QEEG analysis
Interpretation
Case conceptualization
Protocol development
Support for clinics, training programs, and research teams implementing advanced EEG‑based approaches